
Ever wondered if your trading ideas are actually any good, or are they just wishful thinking? If you’re like most of us, you probably have a few strategies you think are solid, but you’re not entirely sure if they’ll work in real life. That’s where backtesting comes in.
In this guide, I’ll show you how to backtest a trading strategy using PHP—yep, good ol’ PHP. Whether you’re a seasoned developer or a trader dabbling in code, this walkthrough is for you. We’ll get a bit technical (there’s real code, not just theory), but I’ll keep things as human as possible. Plus, I’ll throw in some beautiful imagery from Unsplash to keep you inspired.
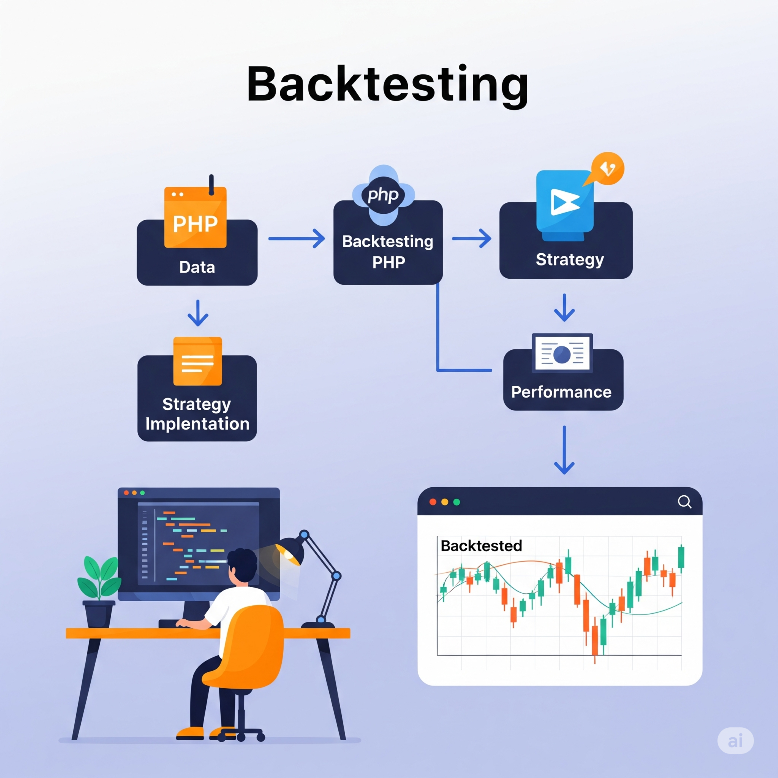
What Is Backtesting, and Why Does It Matter?
Backtesting is the process of simulating a trading strategy using historical data. The idea? If your strategy worked in the past, it might work in the future. Of course, nothing is guaranteed (markets love to humble us), but backtesting helps weed out the truly bad ideas before you risk your hard-earned cash.


Backtesting helps you:
- Validate your trading ideas before you trade real money
- Spot weaknesses or “holes” in your logic
- Understand the risks and drawdowns of your strategy
- Fine-tune parameters for better performance
“In trading, you don’t have to predict the future—you just have to have a system that worked in the past and adapt when it stops working.”
Some Wise Trader
Why PHP for Backtesting?
PHP isn’t the first language that comes to mind for data science or algorithmic trading (Python probably steals the spotlight). But if you’re already comfortable with PHP, or if your infrastructure is built on it, there’s no reason you can’t use it for backtesting. PHP is fast, flexible, and has plenty of libraries for data handling.
Plus, if you’re planning to eventually automate your trades on a web platform, knowing how to backtest in PHP is a superpower.

Step 1: Getting Your Historical Data
The very first step in backtesting is getting your hands on quality historical data. This could be stock prices, crypto data, forex rates—depends on what you’re trading. For this tutorial, let’s assume you’re working with CSV files that look like this:
Date,Open,High,Low,Close,Volume
2024-06-01,100.0,105.0,99.0,102.0,10000
2024-06-02,102.0,106.0,101.0,104.0,15000
2024-06-03,104.0,108.0,103.0,107.0,20000
...
You can get such data from sources like Yahoo Finance, Alpha Vantage, or your broker’s API. Just save it as a CSV file, e.g., historical_data.csv.
Step 2: Loading the Data in PHP
Time to get our hands dirty. Let’s write a PHP function to load the data into an array.
function loadHistoricalData($filename) {
    $data = [];
    if (($handle = fopen($filename, "r")) !== FALSE) {
        $headers = fgetcsv($handle);
        while (($row = fgetcsv($handle)) !== FALSE) {
            $data[] = array_combine($headers, $row);
        }
        fclose($handle);
    }
    return $data;
}

// Usage
$historicalData = loadHistoricalData("historical_data.csv");
This function reads each row as an associative array. Super handy.
Step 3: Defining a Simple Trading Strategy
Let’s keep our first strategy simple—a Moving Average Crossover. When the short-term moving average crosses above the long-term moving average, we buy. When it crosses below, we sell.
- Short MA: 5 days
- Long MA: 20 days
Here’s how to calculate a simple moving average (SMA) in PHP:
function calculateSMA($data, $period, $priceColumn = 'Close') {
    $sma = [];
    $sum = 0;
    for ($i = 0; $i < count($data); $i++) {
        $sum += $data[$i][$priceColumn];
        if ($i >= $period) {
            $sum -= $data[$i - $period][$priceColumn];
        }
        if ($i >= $period - 1) {
            $sma[$i] = $sum / $period;
        } else {
            $sma[$i] = null;
        }
    }
    return $sma;
}
Note: PHP reads CSV values as strings, so you might need to cast them to float:
$data[$i][$priceColumn] = floatval($data[$i][$priceColumn]);Step 4: Generating Buy/Sell Signals
Now, let’s generate buy/sell signals using the crossover logic.
// Calculate moving averages
$shortMA = calculateSMA($historicalData, 5);
$longMA  = calculateSMA($historicalData, 20);

$signals = [];
for ($i = 1; $i < count($historicalData); $i++) {
    if ($shortMA[$i - 1] !== null && $longMA[$i - 1] !== null) {
        if ($shortMA[$i - 1] < $longMA[$i - 1] && $shortMA[$i] > $longMA[$i]) {
            $signals[$i] = 'BUY';
        } elseif ($shortMA[$i - 1] > $longMA[$i - 1] && $shortMA[$i] < $longMA[$i]) {
            $signals[$i] = 'SELL';
        } else {
            $signals[$i] = 'HOLD';
        }
    } else {
        $signals[$i] = null;
    }
}
At this point, you have a “signal” for each trading day: BUY, SELL, or HOLD.
Step 5: Simulating Trades (The Backtest Loop)
Here’s where the magic happens. You’ll simulate what would have happened if you’d followed your strategy over the historical data.
$initialCapital = 10000; // $10,000 starting balance
$position = 0; // 0 = no position, 1 = long
$cash = $initialCapital;
$shares = 0;
$tradeLog = [];

for ($i = 1; $i < count($historicalData); $i++) {
    $signal = $signals[$i];
    $price = floatval($historicalData[$i]['Close']);
    $date = $historicalData[$i]['Date'];

    if ($signal === 'BUY' && $position === 0) {
        $shares = floor($cash / $price);
        $cash -= $shares * $price;
        $position = 1;
        $tradeLog[] = "[$date] BUY: $shares shares at \$$price";
    } elseif ($signal === 'SELL' && $position === 1) {
        $cash += $shares * $price;
        $tradeLog[] = "[$date] SELL: $shares shares at \$$price";
        $shares = 0;
        $position = 0;
    }
}

// If still holding shares at the end, sell them
if ($position === 1) {
    $finalPrice = floatval($historicalData[count($historicalData) - 1]['Close']);
    $cash += $shares * $finalPrice;
    $tradeLog[] = "[End] FINAL SELL: $shares shares at \$$finalPrice";
    $shares = 0;
    $position = 0;
}

echo "Final Balance: $" . round($cash, 2) . "\n";
This loop simulates buying and selling according to signals, logs trades, and calculates your ending balance.
Step 6: Reviewing Results and Metrics
After running the backtest, you should analyze the results:
- Total Return:
($cash - $initialCapital) / $initialCapital * 100 - Number of Trades:
count($tradeLog) / 2(assuming every buy is followed by a sell) - Max Drawdown: The biggest peak-to-trough loss (a bit more complex, but doable in PHP)
- Win Rate: How many trades were profitable?
Here’s a basic way to print your trade history:
foreach ($tradeLog as $trade) {
    echo $trade . "\n";
}
Step 7: Making It Visual
Staring at numbers all day gets old. You can plot your equity curve or signals for a more visual experience. In PHP, you might use libraries like Imagick or generate images for the web. Alternatively, export your results to CSV and plot in Excel, Google Sheets, or Python.

Step 8: Improving and Iterating Your Strategy
No strategy is perfect out of the box. Use your backtest results to tweak parameters—maybe try different moving average periods, add stop-losses, or include volume filters. Rinse and repeat.
And always remember: past results don’t guarantee future returns. Backtesting is a tool, not a crystal ball.
“Backtesting is like rehearsal for a play. If you mess up, you just reset and try again—no money lost.”
Me, After My First Losing Trade
A Real-World Example: Full Backtest Script
Here’s a simplified but complete PHP script that brings everything together. You can copy, paste, and tweak to your heart’s content.
// Step 0: Load data
$data = loadHistoricalData("historical_data.csv");

// Step 1: Calculate MAs
$shortMA = calculateSMA($data, 5);
$longMA  = calculateSMA($data, 20);

// Step 2: Generate signals
$signals = [];
for ($i = 1; $i < count($data); $i++) {
    $short = $shortMA[$i];
    $long = $longMA[$i];
    $prevShort = $shortMA[$i-1];
    $prevLong = $longMA[$i-1];

    if ($prevShort !== null && $prevLong !== null) {
        if ($prevShort < $prevLong && $short > $long) {
            $signals[$i] = 'BUY';
        } elseif ($prevShort > $prevLong && $short < $long) {
            $signals[$i] = 'SELL';
        } else {
            $signals[$i] = 'HOLD';
        }
    } else {
        $signals[$i] = null;
    }
}

// Step 3: Backtest simulation
$initialCapital = 10000;
$cash = $initialCapital;
$shares = 0;
$position = 0;
$tradeLog = [];

for ($i = 1; $i < count($data); $i++) {
    $signal = $signals[$i];
    $price = floatval($data[$i]['Close']);
    $date = $data[$i]['Date'];

    if ($signal === 'BUY' && $position === 0) {
        $shares = floor($cash / $price);
        $cash -= $shares * $price;
        $position = 1;
        $tradeLog[] = "[$date] BUY: $shares shares at \$$price";
    } elseif ($signal === 'SELL' && $position === 1) {
        $cash += $shares * $price;
        $tradeLog[] = "[$date] SELL: $shares shares at \$$price";
        $shares = 0;
        $position = 0;
    }
}

// Final sell if holding
if ($position === 1) {
    $finalPrice = floatval($data[count($data) - 1]['Close']);
    $cash += $shares * $finalPrice;
    $tradeLog[] = "[End] FINAL SELL: $shares shares at \$$finalPrice";
}

echo "Final Balance: $" . round($cash, 2) . "\n";
echo "Total Return: " . round((($cash - $initialCapital) / $initialCapital) * 100, 2) . "%\n";
echo "Number of Trades: " . (count($tradeLog) / 2) . "\n";
foreach ($tradeLog as $trade) {
    echo $trade . "\n";
}
Common Pitfalls in Backtesting
- Lookahead Bias: Accidentally using future data in your calculations. Don’t do it!
- Overfitting: Tweaking your strategy to fit the past perfectly, but failing in the future.
- Ignoring Slippage/Commissions: Real trading has costs. Simulate them if you can.
- Bad Data: Garbage in = garbage out. Always sanity-check your historical data.
If you want to dive deep into these topics, check out [this insightful read on backtesting pitfalls](https://www.investopedia.com/terms/b/backtesting.asp).

Wrapping Up: What Next?
Backtesting in PHP is not only totally doable—it’s a great way to learn more about both coding and markets. You’ve now got the basics for building your own backtest engine. From here, you can:
- Add new indicators (RSI, MACD, Bollinger Bands etc.)
- Test different instruments (forex, crypto, stocks, ETFs...)
- Incorporate transaction costs and slippage
- Build a web dashboard for visualizing results (hello, Laravel!)
- Automate your trading (careful—always test, test, test)
If you’ve got questions, ideas, or want to share your own script, drop a comment below. Happy coding, and may your backtests be green!


PerryIncax
Сайт pwpepwetf.space — це український каталог, який об'єднує найкращі джерела інформації країни. Тут ти знайдеш перевірені джерела, де публікуються актуальні новини, аналітика та ключові події з України та світу. На сайті представлені: - Перевірені новинні сайти з новинами у реальному часі. - Аналітика та аналітичні статті з ключових тем. - Регіональні новини. Якщо тобі важливо отримувати інформацію з надійних джерел, каталог <a href=https://pwpepwetf.space/>pwpepwetf.space</a> стане чудовим помічником!
online pharmacy drugstore
Hello, for all time i used to check webpage posts here early in the dawn, for the reason that i like to find out more and more.